Understanding GIS
Where My Journey Began

How I got into GIS (and got paid to learn it)
Whenever I meet new students, one of the first things they ask is, “How did you get into GIS?”
The short version? It was a skill hardly anyone had when I was about to graduate from college, and someone was willing to pay me to learn it. I mean—who wouldn’t say yes to that?
This all started back when ArcView 3.0 had just come out. I’ve mentioned my mentor and friend Ivan Parra before—a true GIS and Remote Sensing geek—who patiently taught me the ropes. Thanks to him, I didn’t just learn how to use GIS; I learned how to work with satellite imagery (aka remote sensing), digitize vegetation, and classify it by type. That early hands-on experience changed everything.
Although I had studied architecture, GIS opened up a new way of thinking spatially—beyond buildings and cities, to landscapes, regions, and even global scales.
In the early 2000s, I began working at CECARENA, a research center at Tecnológico de Monterrey, collaborating with organizations like World Wildlife Fund (WWF), Conservation International, and the Fondo Mexicano para la Naturaleza y la Conservación.
Around that same time, I also started teaching GIS—initially through small workshops and trainings. It was a great way to reinforce what I was learning, and it sparked a passion for sharing the power of spatial thinking with others that has stayed with me to this day.


Two years later, in 2002, the University of Arizona offered me a research assistantship to pursue a master’s—because I had the skills they needed.
I went on to complete both my master’s and PhD by applying those same GIS skills to get funding and work on real-world projects in conservation, restoration, and natural resource management. GIS wasn’t just a tool—it became the backbone of my academic and professional journey.
So... What is GIS, anyway?
When I was first introduced to GIS, it seemed pretty straightforward: a computer program where you could draw shapes such as points, lines, and polygons. That’s what we call vector data in GIS. But the magic wasn't just in the shapes—it was in the attributes!
Think of it like this: I could draw a polygon representing a patch of forest, and then attach information to it, like the vegetation type, condition, or any other detail. It wasn’t just a map anymore; it was a smart map—one that knew what it was showing.
We also used satellite images to guide our mapping. These are called raster data. If you've ever zoomed in too far on a digital photo and seen a bunch of tiny squares—that's what raster is made of: pixels. Each pixel has a color, and behind that color is a number that the computer reads. In GIS, that number tells us something; it can belike vegetation type, temperature, elevation, or other characteristics, depending on the kind of image.
So GIS, for me, started as a way to combine visuals and data—to draw the world, yes, but also to understand it through layers of information. It was part art, part science, and a lot of curiosity.
But if you search for the definition of GIS online, you’ll quickly realize that it means different things to different people. That’s why I invite you to check out this short video, “What’s GIS?” (Esri, 2024), a great explainer that captures the many ways GIS is used today.
So now that you’ve seen how others define GIS—how would you define it for yourself?
My Grad School GIS projects - mapping what matters!
Let’s kick things off with a couple of projects I worked on during grad school; each one a real-world example of how powerful GIS can be.
The first was an ambitious collaboration between NGOs and research institutions focused on the Colorado River Delta. Our mission? Identify a network of priority conservation sites across the Delta and Upper Gulf of California.
My master’s thesis grew out of this project. I used GIS not just to map the region’s biological and physical features, but also to analyze threats and spot opportunities for conservation. The most exciting part? GIS became a common language for 55 experts—tapping into more than 400 years of combined experience. We weren’t just making maps; we were mapping collective wisdom!
How? By “mapping the possible”—imagining the future of these ecosystems through the eyes of scientists, conservationists, and local experts. (Want to see the final report? Click here!).
Then came PANGAS—short for Pesca Artesanal del Norte del Golfo de California, Ambiente y Sociedad—a project I joined during my Ph.D. This time, GIS helped us understand the where and when of small-scale fisheries, blending scientific data with local knowledge from the fishers themselves.
We visited 17 coastal communities, interviewing fishers about their livelihoods, their practices, and, most importantly, the geography of their daily lives. The ocean may look like an open blue expanse to most of us, but to fishers, it’s a living map—3D, dynamic, and full of meaning.
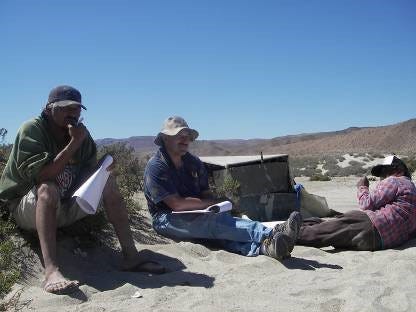
They could describe fishing spots with pirate-level precision: “Ten years ago, I used to fish right here with a simple line; now I travel 80 to 100 kilometers to find anything.” Mapping that shift? No problem with GIS; It is indeed an eye-opening experience!
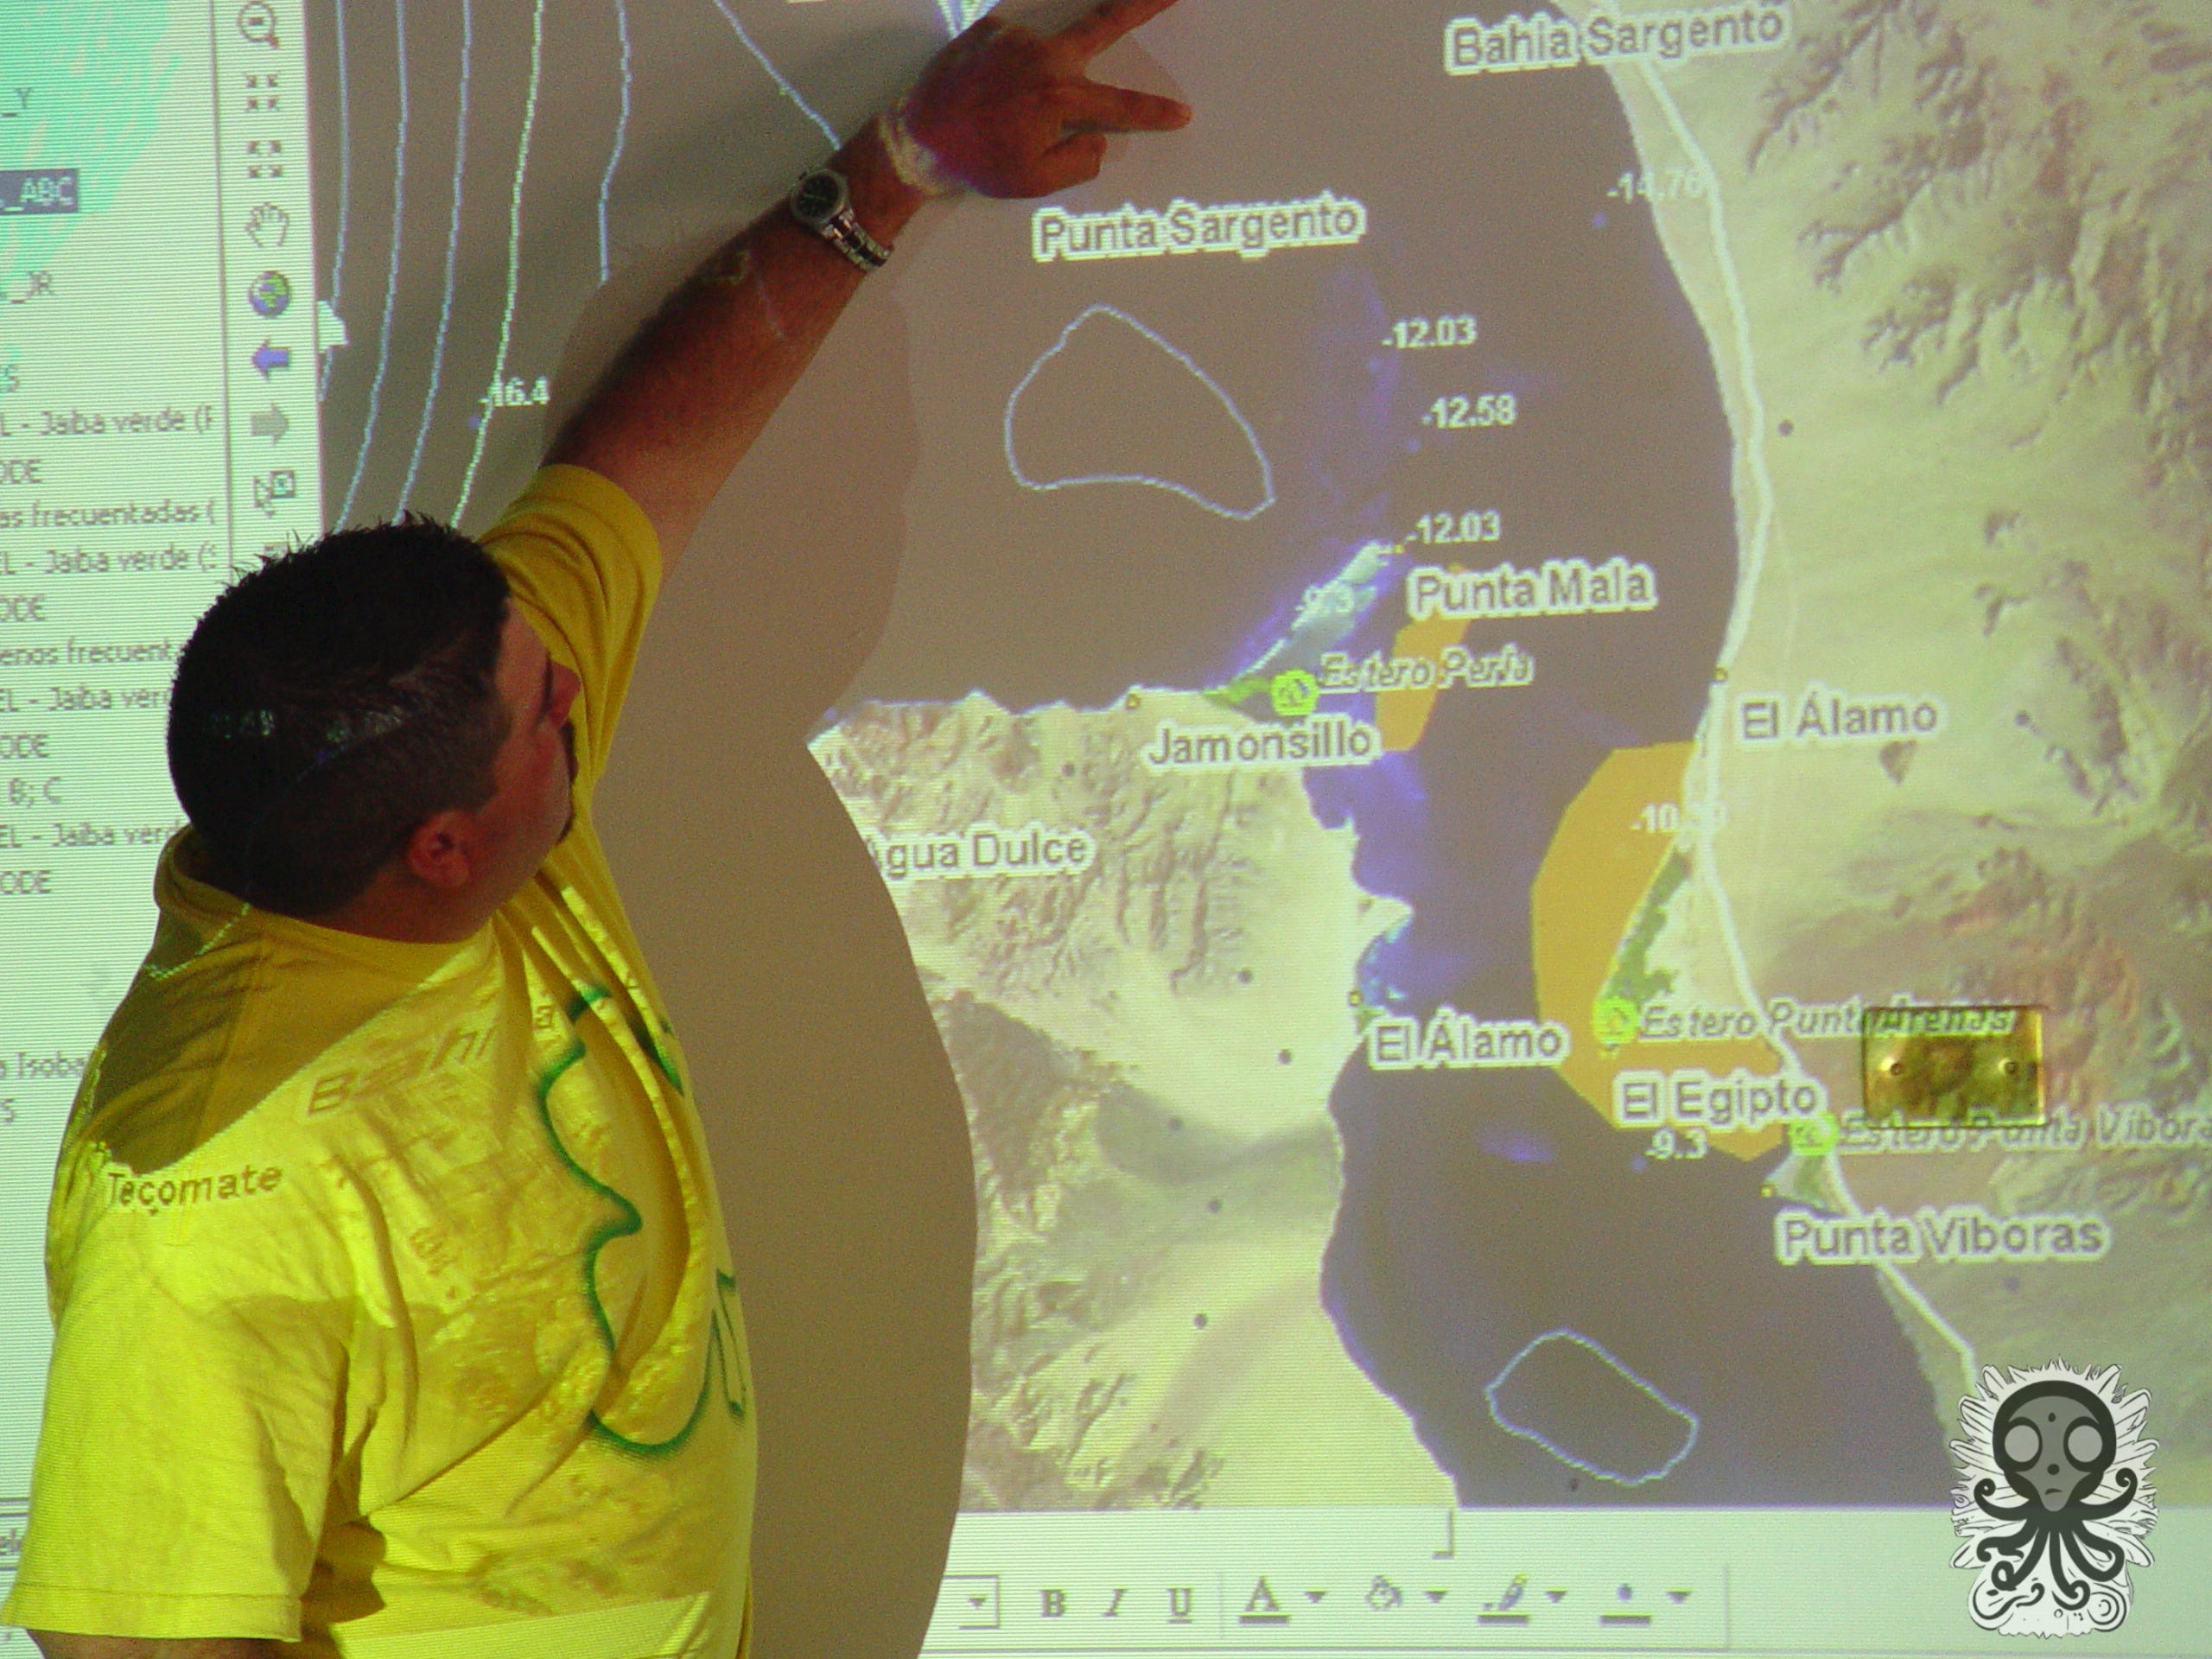
This effort gave us the first real snapshot of artisanal fishing in the northern Gulf of California.

But it didn’t stop there—it sparked new research, policy discussions, and meetings with government and local stakeholders. Suddenly, GIS wasn’t just a research tool—it was the foundation for real-world decisions.
Because here’s the thing: when you understand how things move through space and time, you start to see patterns, and patterns are where smart policy begins.
Why GIS deserves a spot on your radar
Learning GIS is a game-changer for any professional - it was for me!
GIS or spatial thinking can sharpens your ability to make sense of issues shaped by geography—which, let’s be honest, includes most of today’s global challenges.
From climate change to migration, natural resource management to public health, these problems don’t just happen—they happen somewhere. GIS helps you analyze the where, why, and how by uncovering patterns, relationships, and trends across space and time.
But here’s the kicker: learning GIS isn’t just about mastering software. It’s about developing a way of thinking, one that connects data with place, people with problems, and maps with meaning.
Whether you're a student, researcher, policymaker, or just curious about the world, GIS is a skill that will expand your perspective and unlock new ways of understanding the world around you.
If you're looking for inspiration or want to see the power of GIS in action, I highly recommend watching the 2025 ESRI User Conference plenary with Jack Dangermond. It’s a bit long (around two hours), but it offers an incredible overview of where we are today in terms of geospatial technology—complete with real-world examples, powerful visualizations, and insights into where the field is headed.
Want to learn more or swap ideas?
If you’re just getting started with GIS, have questions, or want to share your own experiences, I’d love to hear from you! Feel free to drop a comment, reach out directly, or check out some of the resources I’ve linked throughout this post.
Let’s keep the conversation going—and keep mapping what matters.
Dear Marcia, Thanks for your beautiful explanation. How IA is changing GIS? Cheers!